
Recycled Plastic Properties Database
Real test data for 13 recycled plastics, all tested on the SDS Injection Mini V2. Melt temperatures, MFI values, shrinkage rates, density, flexural modulus, and observational notes from hands-on testing. Use this database alongside our MFI guide and Plastic Types reference to choose the right material for your project.
Our testing methodology
Every plastic in this database was injected on a real Sustainable Design Studio machine, not pulled from a datasheet. Here is what each metric means and how we measured it.
SDS Flow Score
The distance the molten plastic travels through our test channel, measured in millimetres. Higher is better. Plastics that score above 50mm fill thin-walled moulds cleanly. Anything below 20mm needs wider gates and thicker walls.
SDS Thickness Score
The thinnest wall thickness we could reliably produce without short shots or warping, measured in millimetres. Lower means the plastic can do more delicate features. PETG and TPE both hit 0.5mm; ABS struggles below 3mm.
Optimum melt temperature
The barrel temperature at which the plastic flowed best in our tests, given a 10-second melt time. Real-world variability means you may need to nudge 10°C either way depending on humidity, source, and ambient temperature.
MFI range
Melt Flow Index in g/10min, the industry-standard measure of how easily a polymer melt flows. We list the typical range for each polymer. See the MFI guide for what these numbers actually mean in practice.
Density and flexural modulus
Density in g/cm³ tells you how much your finished part will weigh. Flexural modulus in MPa tells you how stiff it will be under bending load. Glass-filled grades like PA6-GF15 sit at the high end of both.
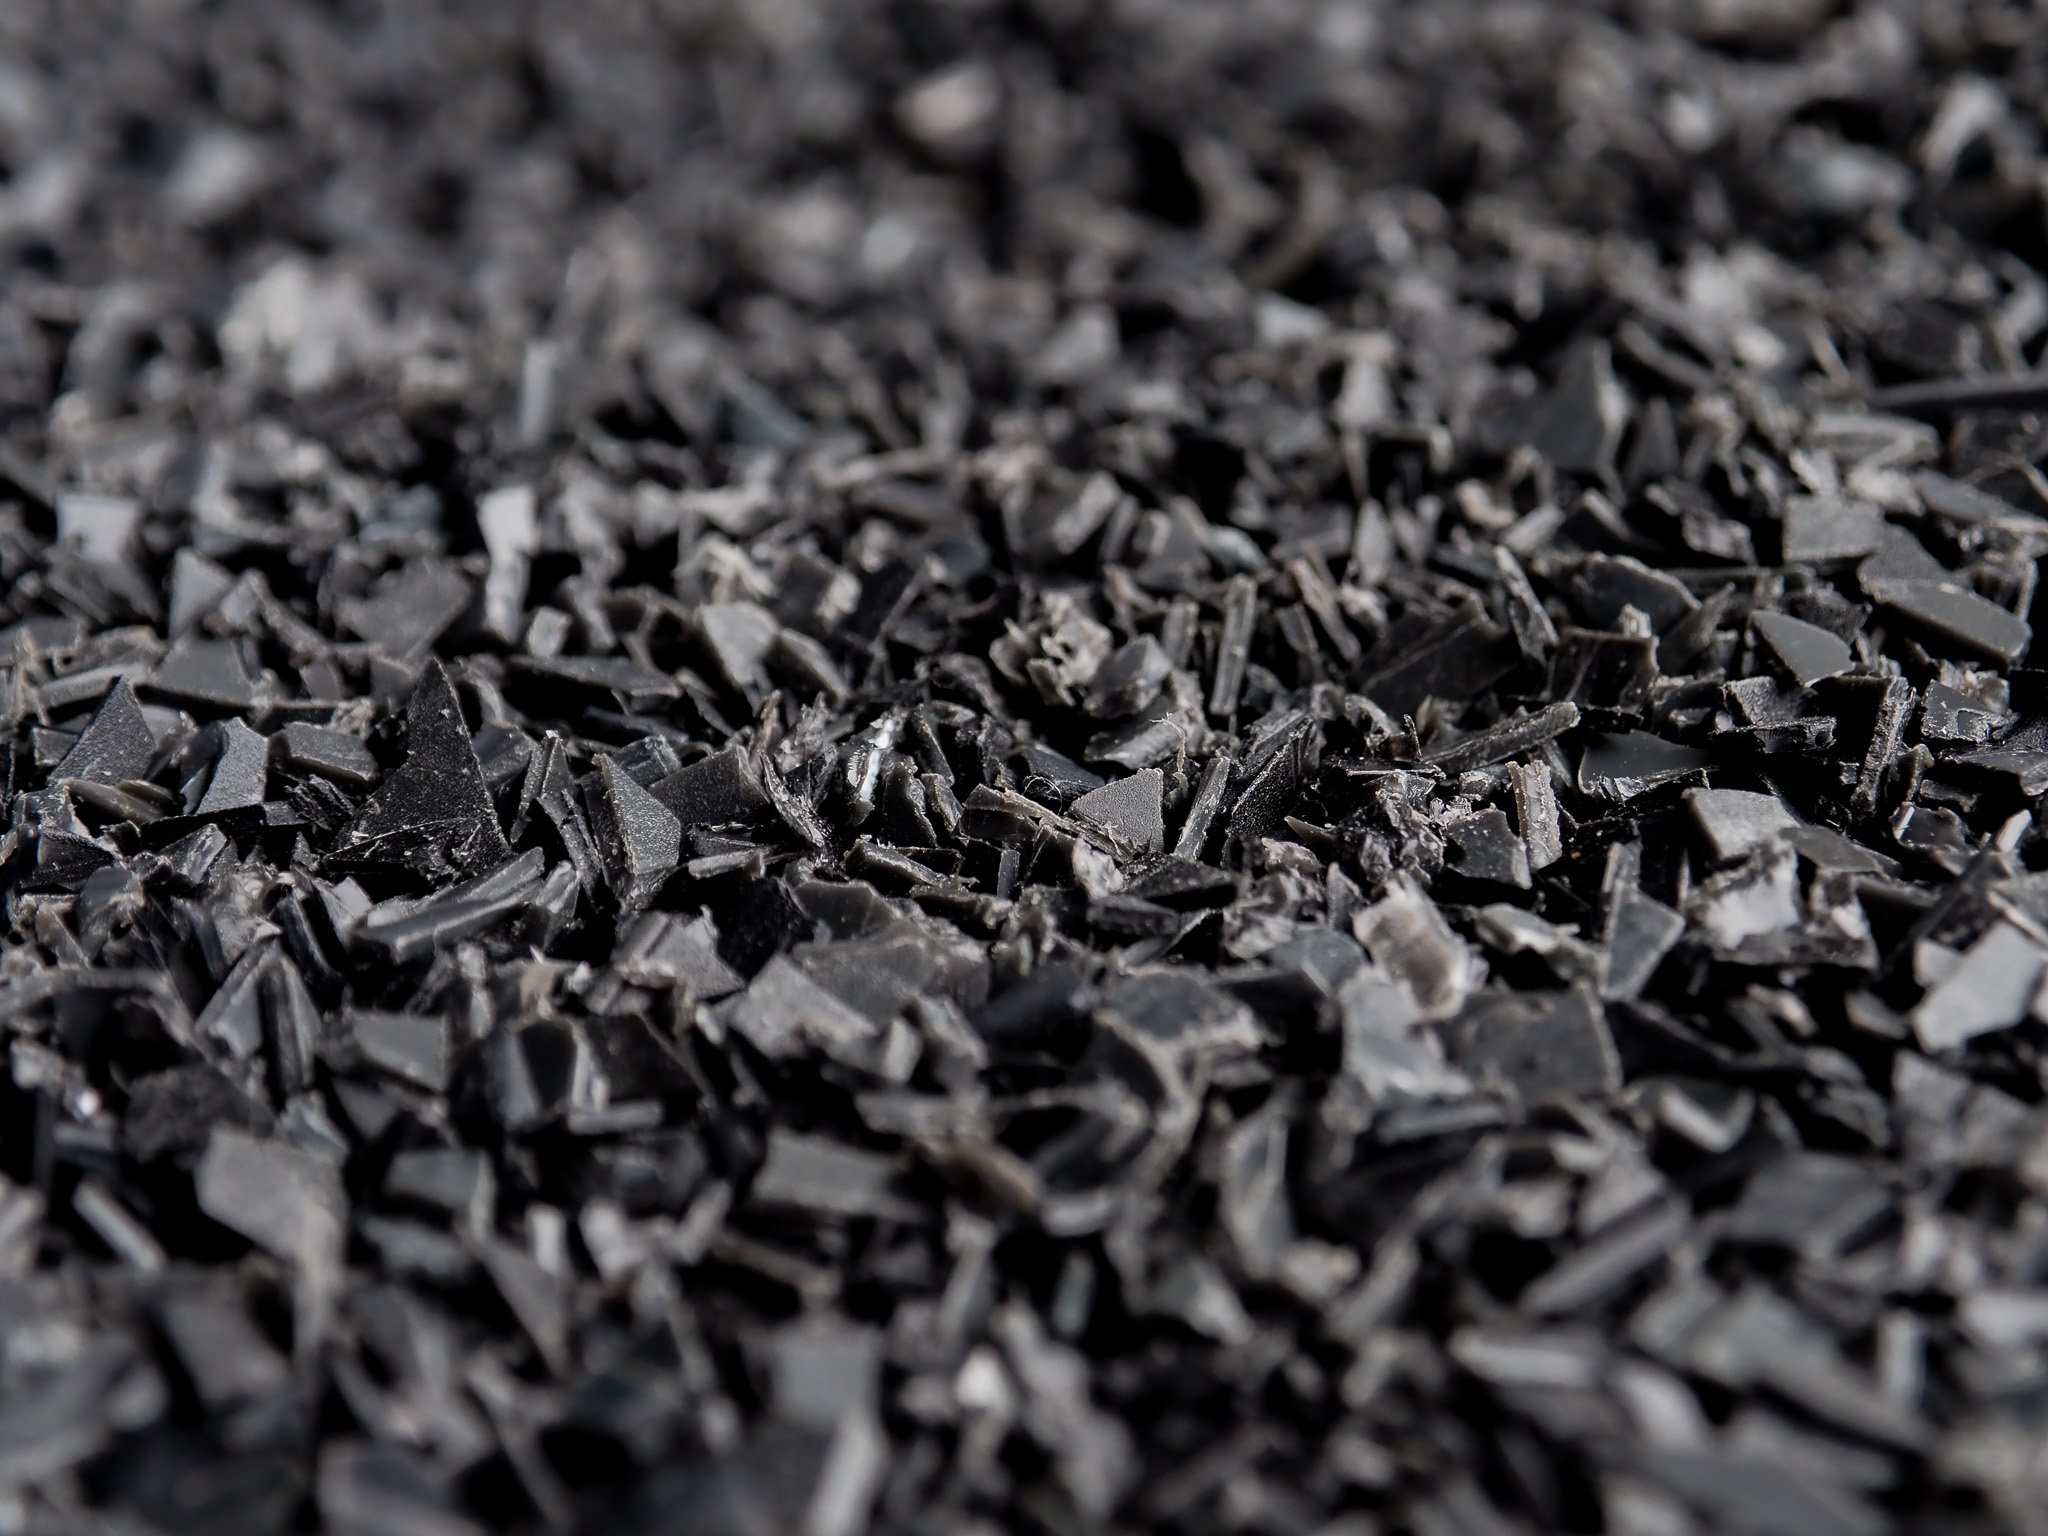
Source tested
The real-world product the recycled material came from. Bottle caps, film canisters, fishing nets, 3D printer waste. Source affects the result; HDPE from film canisters flows differently to HDPE from milk jugs.
Compare every plastic in one view
Sort by any column. Click a row to jump to the full property table, advantages, disadvantages, and our test observations for that plastic.
| Plastic | Family | Flow Score | Thickness | Melt Temp | Shrink | Source Tested |
|---|---|---|---|---|---|---|
| ABSAcrylonitrile Butadiene Styrene | Engineering | 12 cm | 3.5 mm | 230°C | 0.4 to 0.9% | 3D printer filament |
| HDPEHigh Density Polyethylene | Polyolefin | 45.6 cm | 0.75 mm | 190°C | 1.5 to 3% | Film canisters |
| HIPSHigh Impact Polystyrene | Styrenic | 21.2 mm | 1.9 mm | 230°C | 0.4 to 0.7% | Pellets |
| LDPELow Density Polyethylene | Polyolefin | 28.2 mm | 1 mm | 210°C | 1.5 to 5% | Wheel hub caps |
| PA6-GF15Nylon 6 + 15% Glass Fibre | Engineering | 35.1 cm | 2.1 mm | 250°C | 0.3 to 1.2% | Unknown (pellets) |
| PBATPolybutylene Adipate Terephthalate | Biopolymer | 56.1 mm | 1.9 mm | 200°C | 1 to 3.6% | Phone cases |
| PETGPolyethylene Terephthalate Glycol | Polyester | 74.9 cm | 0.6 mm | 240°C | 0.3 to 0.7% | 3D printer filament |
| PLAPolylactic Acid | Biopolymer | 69 cm | 1.5 mm | 200°C | 0.3 to 0.5% | 3D printer filament |
| PPPolypropylene | Polyolefin | 42.75 cm | 1 mm | 220°C | 1.5 to 2.5% | DVD cases |
| PP-GF30 NEWPolypropylene + 30% Glass Fibre | Filled polyolefin | 27.6 mm | 1.5 mm | 230°C | Pending | Shredded, source unknown |
| TPEThermoplastic Elastomer | Elastomer | 84.8 cm | 0.5 mm | 250°C | 1.0 to 3.5% | Unknown (pellets) |
| TPRThermoplastic Rubber 22A | Elastomer | 44.7 mm | 0.7 mm | 210°C | 1.5 to 3% | Unknown (pellets) |
| TPUThermoplastic Polyurethane | Elastomer | 39.3 cm | 0.7 mm | 180°C | 0.5 to 1% | 3D printer filament |
Click a row to jump to the full property table for that plastic. Click any column header to sort, click again to reverse.
Acrylonitrile Butadiene Styrene ABS
| Average Shrink Rate | 0.4 to 0.9% |
| MFI Range | 1 to 8 g/10min |
| Density | 1.03 g/cm³ |
| Flexural Modulus | 1,900 to 2,300 MPa |
| SDS Flow Score | 12 cm |
| SDS Thickness Score | 3.5 mm |
| Optimum Melt Temperature | 230°C |
| Source Tested | 3D printer filament (test print pucks) |
| Colour | Yellow |
| Odour Level | Extremely high |
Advantages
Strong and impact resistant. Heat resistant. Excellent dimensional stability. Balanced mechanical properties.
Disadvantages
Strong odour when molten. Poor UV resistance. Low chemical resistance to some solvents. Flammable without additives. Not biodegradable.
SDS Test Observations
Heat the mould to prevent warping and improve finish. Dry ABS well to avoid bubbles and weak spots from moisture. Control injection temperature carefully: too low makes ABS viscous and hard to fill, too high can cause burning.
High Density Polyethylene HDPE
| Average Shrink Rate | 1.5 to 3% |
| MFI Range | 0.2 to 20 g/10min (grade dependent) |
| Density | 0.941 to 0.965 g/cm³ |
| Flexural Modulus | 800 to 1,500 MPa |
| SDS Flow Score | 45.6 cm |
| SDS Thickness Score | 0.75 mm |
| Optimum Melt Temperature | 190°C |
| Source Tested | Film canisters (granulate) |
| Colour | White |
| Odour Level | Very low |
Advantages
Excellent chemical resistance. High impact strength. Low moisture absorption. Good low temperature performance. Lightweight.
Disadvantages
Poor UV resistance unless stabilized. Lower strength compared to engineering plastics. Limited high temperature performance.
SDS Test Observations
Flows very well compared to other types of HDPE. Not very much flashing (struggles at anything less than 1mm). The surface has a slightly waxy feel. Good release from moulds with minimal sticking.
High Impact Polystyrene HIPS
| Average Shrink Rate | 0.4 to 0.7% |
| MFI Range | 4 to 20 g/10min (grade dependent) |
| Density | 1.04 to 1.06 g/cm³ |
| Flexural Modulus | 1,300 to 2,600 MPa |
| SDS Flow Score | 21.2 mm |
| SDS Thickness Score | 1.9 mm |
| Optimum Melt Temperature | 230°C |
| Source Tested | Pellets |
| Colour | Natural |
| Odour Level | Low |
Advantages
Good impact resistance. Excellent dimensional stability. Easy to machine and fabricate. Low cost. Low shrinkage rate for consistent moulding.
Disadvantages
Poor UV resistance. Brittle compared to engineering plastics. Limited chemical resistance to solvents. Flammable without additives. Not suitable for outdoor use.
SDS Test Observations
Low flow score of 21.2 mm indicates relatively high viscosity. Thickness results were consistent at around 1.5 to 2.5 mm. The material processed cleanly with low odour. Good dimensional stability in finished parts.
Low Density Polyethylene LDPE
| Average Shrink Rate | 1.5 to 5% |
| MFI Range | 2 to 20 g/10min (grade dependent) |
| Density | 0.91 to 0.94 g/cm³ |
| Flexural Modulus | 150 to 250 MPa |
| SDS Flow Score | 28.2 mm |
| SDS Thickness Score | 1 mm |
| Optimum Melt Temperature | 210°C |
| Source Tested | Wheel hub caps (granulate) |
| Colour | Yellow |
| Odour Level | Very low |
Advantages
Very flexible and tough. High impact resistance even at low temperatures. Good chemical resistance. Low moisture absorption. Lightweight with low density.
Disadvantages
Poor UV resistance. Low stiffness and tensile strength. High shrinkage rate can cause warping. Not suitable for high temperature applications. Difficult to bond with adhesives.
SDS Test Observations
Very low odour during processing. Flow improved at higher melt temperatures (210°C gave the best results). Consistent 1 mm thickness across all tests. Similar processing characteristics to HDPE but with noticeably more flexibility in the finished part.
Nylon 6 with 15% Glass Fibre PA6-GF15
| Average Shrink Rate | 0.3 to 1.2% |
| MFI Range | 15 to 30 g/10min |
| Density | 1.25 to 1.40 g/cm³ |
| Flexural Modulus | 4,500 to 6,500 MPa |
| SDS Flow Score | 35.1 cm |
| SDS Thickness Score | 2.1 mm |
| Optimum Melt Temperature | 250°C |
| Source Tested | Unknown (pellets) |
| Colour | Black |
| Odour Level | High |
Advantages
High strength and stiffness. Excellent resistance to wear and abrasion. Enhanced dimensional stability due to glass fiber reinforcement. Good heat resistance. Low moisture absorption compared to unreinforced PA6.
Disadvantages
Higher brittleness compared to standard PA6 due to glass fibers. More difficult to process and mould. Can be abrasive to tooling and equipment. Requires careful control of temperature and pressure during moulding.
SDS Test Observations
The surface has a fine-gritted texture. The material is very strong, barely flexes and is hard to break.
Polybutylene Adipate Terephthalate PBAT
| Average Shrink Rate | 1 to 3.6% |
| MFI Range | 3 to 5 g/10min |
| Density | 1.26 g/cm³ |
| Flexural Modulus | 126 MPa |
| SDS Flow Score | 56.1 mm |
| SDS Thickness Score | 1.9 mm |
| Optimum Melt Temperature | 200°C |
| Source Tested | Phone cases (granulate) |
| Colour | Black |
| Odour Level | Medium (coffee like smell) |
Advantages
Biodegradable and compostable. Good toughness and flexibility. High tear resistance. Similar mechanical properties to LDPE. Wide processing temperature window.
Disadvantages
Lower melting point than most plastics. Significant barrel expansion during heating. Can produce air bubbles if not dried properly. Higher cost than commodity plastics. Lower stiffness and strength.
SDS Test Observations
A lot of expansion in the barrel during heating. The material has a distinctive coffee like smell. Air bubbles can form in thicker sections. Best results at 200°C with consistent flow. The finished parts are flexible with good toughness.
Polyethylene Terephthalate Glycol PETG
| Average Shrink Rate | 0.3 to 0.7% |
| MFI Range | 6 to 22 g/10min |
| Density | 1.27 g/cm³ |
| Flexural Modulus | 2,000 to 2,400 MPa |
| SDS Flow Score | 74.9 cm |
| SDS Thickness Score | 0.6 mm |
| Optimum Melt Temperature | 240°C |
| Source Tested | 3D printer filament (test print) |
| Colour | Transparent green |
| Odour Level | Medium |
Advantages
High impact resistance. Transparent. Excellent chemical resistance. Easily thermoformed and 3D printed. Low shrinkage.
Disadvantages
Prone to moisture absorption, requiring drying before processing. Can be more brittle compared to other plastics like PP. Higher cost compared to standard PET.
SDS Test Observations
Remained transparent after injection. Flowed out the nozzle like honey/syrup if the jack wasn't in place. The material needed to be dried before testing; as a result, bubbles developed and these caused it to overflow out of the barrel when heating. Very brittle and easy to crack/break getting items out of the mould.
Polylactic Acid PLA
| Average Shrink Rate | 0.3 to 0.5% |
| MFI Range | 6 to 8 g/10min |
| Density | 1.24 g/cm³ |
| Flexural Modulus | 2,996 to 3,750 MPa |
| SDS Flow Score | 69 cm |
| SDS Thickness Score | 1.5 mm |
| Optimum Melt Temperature | 200°C |
| Source Tested | 3D printer filament (3D printed shot) |
| Colour | Yellow |
| Odour Level | Medium |
Advantages
Biodegradable. Low shrinkage. Non-toxic.
Disadvantages
Brittle. Low heat resistance. Prone to moisture absorption. Limited chemical resistance. Lower durability outdoors.
SDS Test Observations
Use a cool mould for easy demoulding. PLA drips out the nozzle like syrup without the jack. Dry PLA to prevent bubbles and overflow.
Polypropylene PP
| Average Shrink Rate | 1.5 to 2.5% |
| MFI Range | 8 to 20 g/10min |
| Density | 0.905 to 0.92 g/cm³ |
| Flexural Modulus | 1,300 to 1,800 MPa |
| SDS Flow Score | 42.75 cm |
| SDS Thickness Score | 1 mm |
| Optimum Melt Temperature | 220°C |
| Source Tested | DVD cases (granulate) |
| Colour | Black |
| Odour Level | Low |
Advantages
High chemical resistance. Lightweight. Good fatigue resistance. Low cost.
Disadvantages
Poor UV resistance. Lower impact strength in cold temperatures. Difficult to bond with adhesives.
SDS Test Observations
The finished surface is very smooth, reflects the smooth surface of the mould, and is almost shiny. The plastic drips from the nozzle if not blocked by the jack. The black plastic stays around in the barrel for a long time after switching material.
Polypropylene + 30% Glass Fibre PP-GF30 NEW
| Average Shrink Rate | 0.4 to 1.2% (industry typical) |
| MFI Range | 5 to 15 g/10min |
| Density | 1.13 to 1.20 g/cm³ |
| Flexural Modulus | 4,500 to 7,000 MPa |
| SDS Flow Score | 27.6 mm |
| SDS Thickness Score | 1.5 mm |
| Optimum Melt Temperature | 230°C |
| Source Tested | Shredded, source unknown |
| Colour | Black |
| Odour Level | Low |
Advantages
High stiffness from the glass fibre reinforcement. Excellent dimensional stability. Good heat resistance. Significantly lower shrinkage than unfilled PP. Cost-effective compared to traditional engineering plastics like PA6-GF15.
Disadvantages
Abrasive on tooling, glass fibres wear barrels and screws faster than unfilled grades. More brittle than pure PP. Anisotropic shrinkage means warping is possible on long thin parts. Visible fibre texture on the finished surface. Requires higher melt pressure than commodity PP.
SDS Test Observations
Five shots run on the Injection Mini V2 in June 2026 from shredded source material. Consistent flow between 24mm and 31mm with thicknesses from 1.5mm to 2.5mm. The 230°C runs gave the best balance of flow and thickness. Standard PP processing parameters apply, but flow is noticeably lower than pure PP, expect to widen mould gates if you are switching from a virgin PP recipe.
Thermoplastic Elastomer TPE
| Average Shrink Rate | 1.0 to 3.5% |
| MFI Range | 5 to 25 g/10min |
| Density | 0.88 to 1.15 g/cm³ |
| Flexural Modulus | 1 to 500 MPa (varies widely) |
| SDS Flow Score | 84.8 cm |
| SDS Thickness Score | 0.5 mm (lowest score) |
| Optimum Melt Temperature | 250°C |
| Source Tested | Unknown (pellets) |
| Colour | Clear/yellow |
| Odour Level | Medium (slight rubber smell) |
Advantages
Highly flexible and elastic. Soft-touch feel. Good impact resistance. Recyclable and can be re-moulded. Resistant to many chemicals.
Disadvantages
Higher cost compared to standard plastics. May degrade in extreme temperatures. Requires careful processing to avoid deformation. Can absorb moisture.
SDS Test Observations
Strong smell when opening the mould, which also lingers on the product. Very fluid material with lots of flashing if the mould is too warm. White smoke is generated when melting.
Thermoplastic Rubber (22A) TPR
| Average Shrink Rate | 1.5 to 3% |
| MFI Range | 5 to 30 g/10min (hardness dependent) |
| Density | 0.90 to 0.97 g/cm³ |
| Flexural Modulus | 1 to 20 MPa |
| SDS Flow Score | 44.7 mm |
| SDS Thickness Score | 0.7 mm |
| Optimum Melt Temperature | 210°C |
| Source Tested | Unknown (pellets) |
| Colour | Black |
| Odour Level | Low |
Advantages
Highly flexible and elastic. Excellent abrasion resistance. Good weathering and chemical resistance. No vulcanisation required. Can be recycled and re-moulded multiple times.
Disadvantages
Low stiffness and load bearing capacity. Properties vary significantly with formulation. Limited high temperature resistance. Can be more expensive than standard rubbers.
SDS Test Observations
Very easy material to work with. Some flashing observed, particularly when the mould was warm. Excellent thickness score of 0.7 mm, suitable for thin walled parts. The material flows well and fills the mould consistently.
Thermoplastic Polyurethane TPU
| Average Shrink Rate | 0.5 to 1% |
| MFI Range | 5 to 15 g/10min |
| Density | 1.23 g/cm³ |
| Flexural Modulus | 35 MPa |
| SDS Flow Score | 39.3 cm |
| SDS Thickness Score | 0.7 mm |
| Optimum Melt Temperature | 180°C |
| Source Tested | 3D printer filament (3D printed shot) |
| Colour | Red |
| Odour Level | Low |
Advantages
Highly flexible. Good abrasion resistance. Elasticity. Chemical resistance. Weather and UV resistance.
Disadvantages
Moderate heat resistance. Prone to hydrolysis. Can be sensitive to low temperatures. Limited dimensional stability. Softness limits heavy load applications.
SDS Test Observations
Dry TPU before use to avoid bubbles and weak spots. Thickness results were good, suitable for thin parts.
Explore the full dataset
Download the complete material testing datalog with every individual shot, or browse the reference photos from our lab tests. Both are kept in sync with the data shown above.
Full dataset (Google Sheets)
Every individual shot with melt temperature, mould temperature, pressure, flow result and thickness. Updated as we test new materials.
Open spreadsheetReference photos (Google Drive)
Lab shots of each test piece showing flow path, surface texture, and finish quality. Useful for visual comparison when judging your own materials.
Open folderAll tested on Sustainable Design Studio machines
Every shot in this database was run on real production equipment, not lab-only prototypes. Buy the same kit and you can reproduce the results.
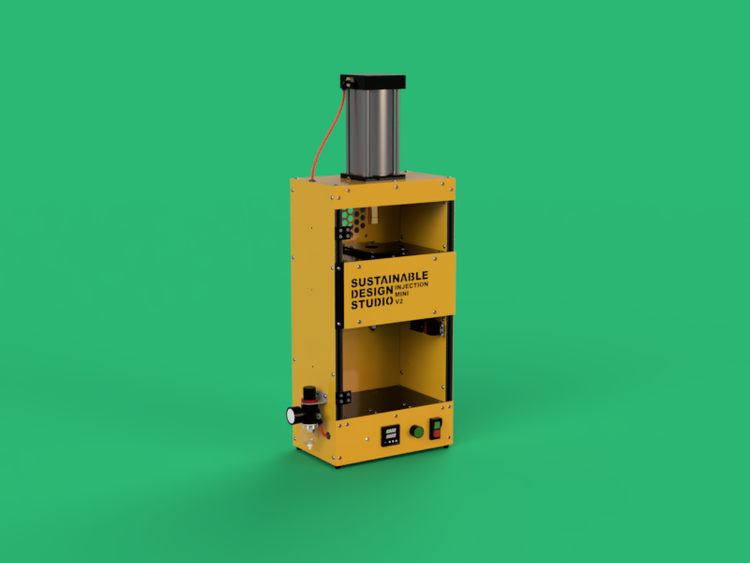
Injection Mini V2
Desktop injection moulding for small to mid-size parts. The primary test rig for this database.
View machine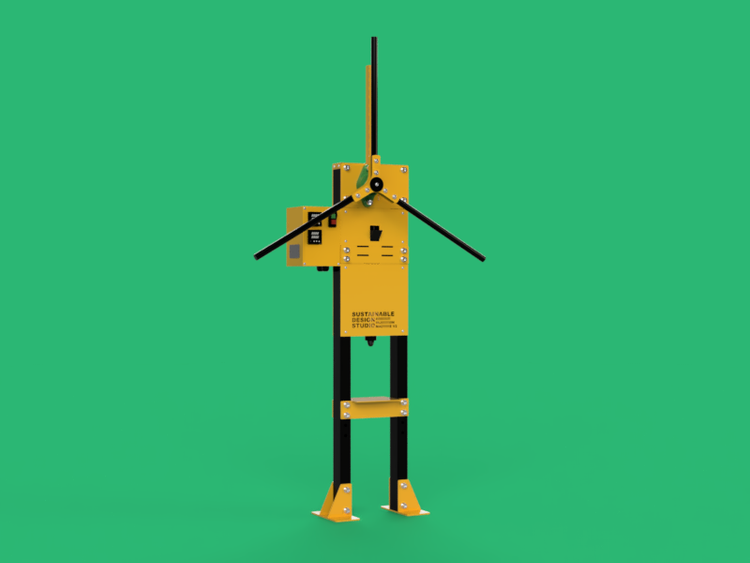
Arbour Injection Machine V2
Higher pressure injection for engineering plastics like glass-filled nylon and ABS.
View machine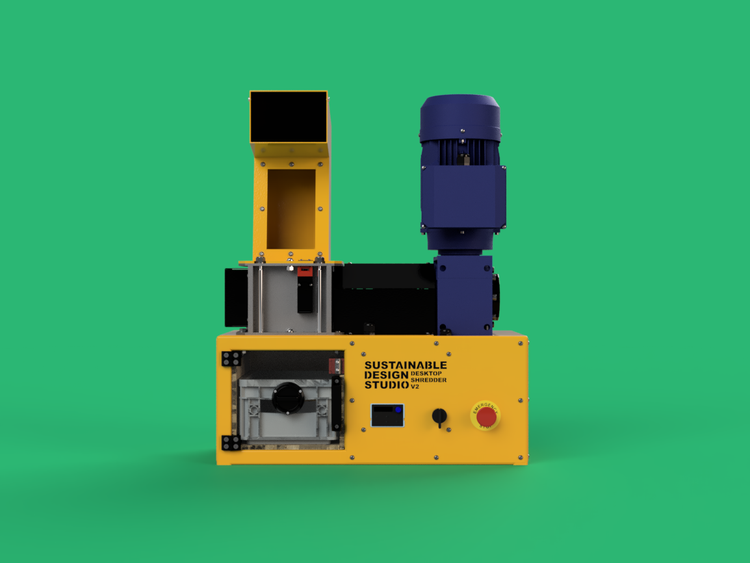
Desktop Shredder V2
Shred plastic waste into granulate ready for injection. Source material prep starts here.
View machineResources that pair with this database
Three picks from the Sustainable Design Studio resources library. Knowing the properties is one half of the picture, knowing what to do with them is the other.
 Guide
Guide
Plastic types
The full breakdown of common plastic types, their properties and recycling codes.
 Guide
Guide
Plastic identification
How to sort and identify different types of plastic before you start recycling.
 Guide
Guide
Understanding MFI
Why a high melt flow index matters when injection moulding with recycled plastics.
Got a plastic we should test?
If you have a feedstock you'd like to see in this database, send us a sample and we'll run it through the rig. We're always adding more.